AAPS screens
The main screen

This is the first screen you will come across when you open AAPS, and it contains most of the information that you will need day to day.
Section A - Top bar
The menu (☰) on the left opens the navigation drawer with Treatments history, History browser, Statistics, Profile helper, Maintenance, Setup Wizard, Configuration and more.
The search bar finds settings, dialogs and documentation — just start typing (see Global search).
The Settings (gear) icon on the right opens all settings.
Section B - Status block
Current blood glucose
The latest blood glucose reading from your CGM is shown in the big circle on the left, together with the difference to the previous reading (delta) and the age of the reading.
The color of the BG value reflects the status to the defined range.
green = in range
red = below range
yellow = above range


Loop status

Next to the BG circle, an icon shows the running mode of the loop (from top to bottom in the picture):
Green circle = closed loop, loop running
Purple circle with dotted line = low glucose suspend (LGS)
Blue circle with dotted line = open loop
Red circle with cross = loop disabled (not working permanently)
Red pause icon = loop suspended (temporarily paused but basal insulin will be given) - remaining time is shown next to the icon
Grey circle with plug = pump disconnected (temporarily no insulin dosage at all) - remaining time is shown next to the icon
Press the icon to open the Loop dialog. The dialog’s content depends on the current state:
While the loop is running (closed, open or LGS), you can switch the running mode (Closed Loop, Low Glucose Suspend, Open Loop or Disable loop), suspend the loop or disconnect the pump for a chosen duration.
While the loop is disabled, you can re-enable it by selecting a running mode, or disconnect the pump.
While the loop is suspended, you can resume it, disconnect the pump, or pick a new duration under Suspend loop to extend the suspension.
While the pump is disconnected, you can reconnect the pump, or pick a new duration under Disconnect pump to extend the disconnection.
When you extend a suspension or a disconnection, the new duration starts from now: it replaces the remaining time, it is not added to it. You do not have to resume or reconnect first.
The dialog while the loop is running in closed loop:

The dialog while the loop is suspended, with Resume and the durations to extend the suspension:

The dialog while the pump is disconnected, with Reconnect Pump and the durations to extend the disconnection:

The dialog in Low Glucose Suspend, in open loop and while the loop is disabled only differs in the running modes it offers:


This is how the main screen looks in each mode. The color band at the top of the graph changes at the time of the switch.
Low Glucose Suspend:

Open loop:

Loop disabled:

Loop suspended — the remaining time is shown next to the icon:

Pump disconnected — the remaining time is shown next to the icon. The treatment buttons stay in the QuickLaunch toolbar, so you can still record insulin given with a pen or carbs:

A validation is required after each selection.
Alarm: the pump did not accept the zero temp basal
While the pump is disconnected, AAPS keeps a zero temporary basal on the pump and sets it again if it is missing. If this still fails after 10 minutes, AAPS raises an urgent alarm: “The pump did not accept the zero temp basal. It may still be giving basal insulin. Check the pump.” The alarm repeats every 15 minutes until the zero temporary basal is set or the disconnection ends. If you see it, check your pump: it may be delivering basal insulin although AAPS shows it as disconnected.
Note: the modes offered depend on your progress in the Objectives — Closed Loop and LGS only become available as you complete them.
BG warning sign
If AAPS detects a problem with the BG readings it receives, a shortcut to your BG source (named after it, for example xDrip+ BG) appears in the bottom bar of the main screen, with a red warning badge. Tap it to open the BG source screen.
Duplicate BG data
The red warning sign is signaling you to get active immediately: You are receiving duplicate BG data, which prevents the loop from doing its work right. AAPS cannot calculate your BG trend reliably from duplicated readings, so it stops correcting.
If your loop was closed, AAPS switches it to Low Glucose Suspend (LGS) mode: the loop icon turns purple.

Press the loop icon: the Constraints card at the top tells you why: “BgQualityCheck: LGS mode due to doubled values in BG source”.

Your loop is running in Low Glucose Suspend
Your loop keeps running, but only to protect you against lows: AAPS can still reduce or suspend your basal, and it will not give any correction insulin until you solve this issue !
You need to find out why you get duplicate BGs:
Is Dexcom bridge enabled on your Nightscout site? Disable the bridge by going to the administration panel of your Nightscout instance, edit the “enable” variable and remove the “bridge” part there. (For Heroku details can be found here.)
Do multiple sources upload your BG to Nightscout? If you use the BYODA app, enable the upload in AAPS but do not enable it in xDrip, if you use that.
Do you have any followers that might receive your BG but do also upload it again to your Nightscout site?
Last resort: In NSClient settings, select the Synchronization settings and disable the “Receive CGM data from NS” option.
To remove the warning immediately and get your loop correcting again, delete the duplicate entries from the BG source screen: tap the shortcut in the bottom bar. The duplicate reading is highlighted in red. Long press a reading to start selecting, tick the duplicates and tap the trash icon at the top right.

However, when there are a lot of duplicates, it might be easier to
reset your database in the maintenance menu and
import your settings again
Switch back to Closed Loop yourself
AAPS does not return to Closed Loop on its own once the duplicates are gone. Press the loop icon on the main screen and select Closed Loop again.
Flat BG data
With some BG sources (Libre 1, AiDEX, Glutec, Medtronic and sources that do not report their sensor type), AAPS also checks for readings that do not change: if your BG has changed by less than 2 mg/dL (0.1 mmol/L) for 45 minutes, the data is considered wrong. The BG source shortcut then shows a red flat-trend badge, and the loop stops any high temporary basal and gives no correction insulin until the readings change again. Check your sensor and the app that sends the readings.
Irregular BG data
When readings arrive at irregular intervals or some are missing, AAPS recalculates 5-minute values from the readings it has. This happens for example after a sensor change, or with Libre sensors, whose timing slips a minute or two every few hours. The loop keeps working and you do not have to take any action. AAPS 4 no longer shows a yellow warning sign for this.
Current Profile
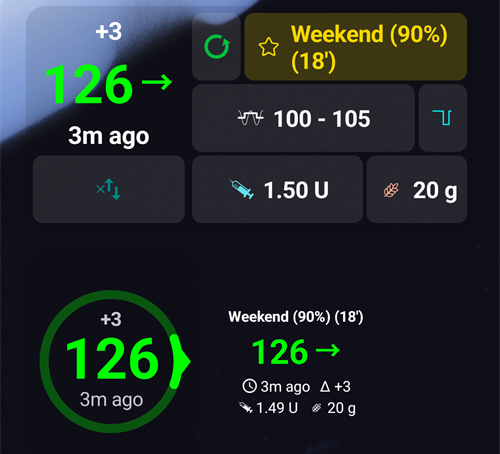
The current profile is displayed next to the star icon.
Tap the profile name to open the Profile screen, where you can view the profile details and switch between different profiles.
To change the profile percentage (and its duration), tap the profile name, then tap the round ▶ (Activate) button at the bottom right of the Profile screen. In AAPS 3.x this screen opened with a long press on the profile name; in AAPS 4 a long press does nothing. Step by step: Change the Profile Percentage.

Regular display with a standard profile activation.
Profile switch with a specific percentage of 90% and a remaining duration of 9 minutes — the profile name turns yellow while a temporary profile switch is running.
Profile switch with a time shift of 1 hour and a remaining duration of 9 minutes.
Target

The current target blood glucose level is displayed below the profile name.
Short press the target to open the Temporary Target screen.
Regular display: the target range defined in your profile.
If a temp target is set, the target turns yellow/orange with the icon of the used preset, and the remaining time in minutes is shown in brackets.
Visualization of Dynamic target adjustment
When using the SMB algorithm and Autosens functionality, AAPS can dynamically adjust your target based on sensitivity.
Enable either one or both of the following options in OpenAPS SMB settings:
“Sensitivity raises target” and/or
“Resistance lowers target”
If AAPS detects resistance or sensitivity, the target will change from what is set from profile, and the displayed target changes color to indicate the adjustment.
IOB, COB, basal and sensitivity
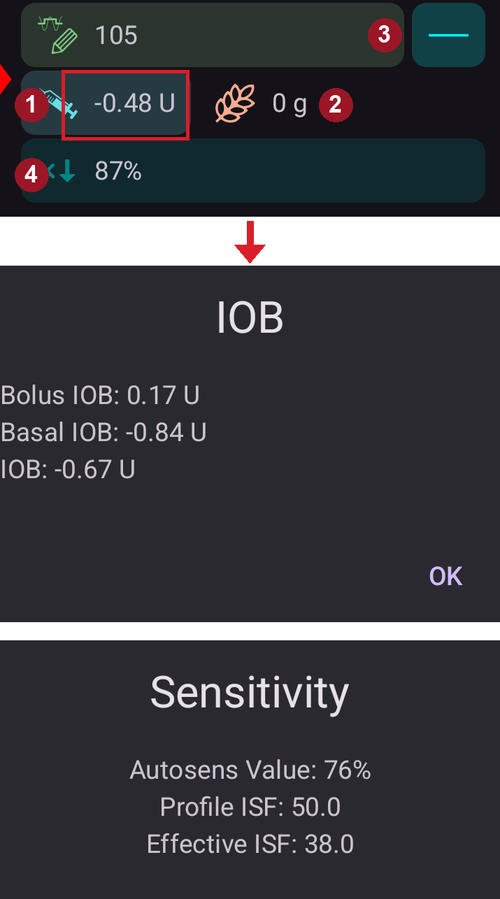
Syringe: insulin on board (IOB) - amount of active insulin inside your body
The insulin on board figure would be zero if just your standard basal was running and there was no insulin remaining from previous boluses.IOB may be negative if there have recently been periods of reduced basal.
Press the chip to see the split of bolus and basal insulin (first dialog in the picture — here with a negative IOB after a period of reduced basal)
Grain: carbs on board (COB) - yet unabsorbed carbs you have eaten before
The teal button on the right reflects the current basal delivery: a flat line when the profile basal is running, a changed icon while a temporary basal rate is active
The percentage row shows the current sensitivity (Autosens / DynamicISF). When the loop changes your ISF, the row also shows the profile ISF, an arrow and the ISF the loop uses now, for example “80% 2.0 ↗ 2.5”. Press it to see the Autosens value and the effective ISF (second dialog in the picture). If the loop works with a different value than the last Autosens result (for example because a temp target changes your sensitivity), the dialog also shows that value as Autosens in algorithm. When Autosens is off, the loop keeps your profile ISF and no effective ISF is shown.
The IOB dialog, opened by pressing the IOB chip:

Press the teal button to see the temporary basal rate that is running, when it started and how long it has been running:

Carbs required

Carbs suggestions are given when the reference design detects that it requires carbs.
This is when the oref algorithm thinks it can’t rescue you by zero-temping, and you will need carbs to fix.
The carb notifications are much more sophisticated than the bolus calculator ones. You might see a carbs suggestion while the bolus calculator does not show missing carbs.
Carb required notifications can be pushed to Nightscout if wished, in which case an announcement will be shown and broadcast.
Section C - Status row

The status row gives a visual warning for
Cannula age
Insulin age (days reservoir is used) and reservoir level (units)
Sensor age
Pump battery age and level (%)
If threshold warning is exceeded, values will be shown in yellow.
If threshold critical is exceeded, values will be shown in red.
The age is always shown in its short form, whatever the screen size: 4h on the first day, 3d4h later.
Thresholds can be changed via the small Settings icon shown when the status row is expanded (chevron on the right) — see Status lights.
The expanded status panel also has a button at the end of some rows to record a change, which resets the corresponding age: Add on the Sensor row records a sensor insertion. If your pump supports it, Prime/Fill appears on the Cannula (or Patch pump) and Insulin rows, and Add on the Pump battery row.

Depending on the pump you use, you may not have all of these icons.
Sensor level (battery)
Works for CGM with an additional transmitter such as MiaoMiao 2. (Technically sensor has to send battery level information to xDrip.)
Thresholds can be set in Status lights.
Section D - Main graph

The graph shows your blood glucose (BG) as read from your glucose monitor (CGM).
Use scroll and pinch-zoom gestures on the graph to change the visible time frame.
The green area reflects your target range.
This information is also shown on this graph :
Manual boluses: blue triangle just above the BG curve, pointing down at the reading of that moment, with the insulin amount
Carbs entries: orange triangle just below the BG curve, pointing up at the reading, with the carb amount. A meal entered with its bolus looks like one marker, split by the reading.
The triangles come in three sizes (small, medium, large), following the amount compared with the largest of the day. If there is no BG reading at that time (sensor gap), the triangle is drawn at the bottom of the graph.
BG checks and calibrations: drawn at their own measured value, so you can compare them with the sensor curve
Target as defined in the profile or modified by temporary target: green line
Profile switches: star icons at the top of the graph
Loop status: color band at the top of the graph when the running mode is anything else than closed loop: blue = open loop, purple = LGS, red = loop disabled, yellow = loop suspended, grey = pump disconnected, orange = superbolus (in the screenshot: purple, then yellow). The history of these changes is listed in Running mode
SMBs are not drawn on the BG graph (there would be one every few minutes): they are shown on the IOB graph.
Tap a BG check in the graph to see its value, and its note if you wrote one.
See the values at a given time
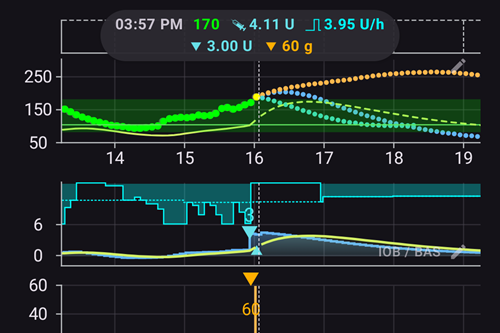
Press and hold the BG graph for a moment to see the values at one reading. A dot marks the nearest reading, a dashed line is drawn at that time in all the graphs, and a pop-up at the top of the graph shows:
the time and the BG value
IOB, COB (only when it is above 0 g) and the basal rate at that time — the basal icon shows whether a temporary basal rate was running, as on the main screen
any bolus, SMB or carbs at that time, with the same triangles as in the graphs
Keep your finger on the screen and move it left or right to go from one reading to the next. You feel a light tick at each reading, and the graph does not scroll while you do this. The pop-up stays for 2 seconds after you lift your finger.
This works the same way on the additional graphs below the BG graph (IOB, COB…): press and hold any of them.
Clock changes
When the clock of the phone jumped, at a daylight saving change or in a new time zone, a dashed vertical line marks that moment in the BG graph, with a small clock icon at its foot. The same dashed line runs through the additional graphs below.

Activate optional information
Press the pencil icon in the top-right corner of the graph to open the graph settings:

Graph height adjusts how tall the graph is drawn.
ACT overlays the insulin activity curve: a solid yellow-green line ━━━━ (not to be confused with the dotted yellow UAM prediction)
PRED overlays the prediction lines (see below)
Prediction lines
When PRED is on, AAPS draws its predictions as dotted lines to the right of the “now” line. Each prediction has its own color. The dark theme uses lighter shades of the same colors, and a line inside the green target range can look slightly greener.
Line |
Light theme |
Dark theme |
What it predicts |
|---|---|---|---|
IOB (blue) |
●●●● |
●●●● |
insulin only |
COB (orange) |
●●●● |
●●●● |
carbs on board |
UAM (yellow) |
●●●● |
●●●● |
unannounced meal |
ZT (cyan) |
●●●● |
●●●● |
zero-temp (insulin stopped) |
aCOB (pale orange) |
●●●● |
●●●● |
older AMA algorithm only |
When two predictions give the same values, their dots overlap and you only see one of the colors (for example, UAM on top of IOB when BG is flat).
COB line (orange): carbs on board (orange is used throughout AAPS for COB and carbs)
This prediction line shows where your BG (not where COB itself!) will go based on the current Profile settings, assuming that the deviations due to carb absorption remain constant. This line only appears if there are known COB.
IOB line (blue): insulin on board (blue is used throughout AAPS for IOB and insulin)
This prediction line shows what would happen under the influence of insulin only. For example if you dialed in some insulin and then didn’t eat any carbs.
ZT line (cyan): zero-temp (predicted BG if temporary basal rate at 0% would be set)
This prediction line shows how the BG trajectory line would change if the pump stopped all insulin delivery (0% TBR). The line stops once it rises above your target.
This line appears only when the SMB algorithm is used.
UAM line (yellow): unannounced meals
Unannounced meals means that a significant increase in glucose levels due to meals, adrenaline or other influences is detected. Prediction line is similar to the orange COB line, but it assumes that the deviations will taper down at a constant rate (by extending the current rate of reduction).
This line appears only when the SMB algorithm is used, Enable UAM is on in the OpenAPS SMB settings, and BG is rising more than insulin alone explains.
aCOB line (pale, see-through orange): accelerated carbohydrate absorption
Similar to COB, but assuming a static 10 mg/dL/5m (0.555 mmol/L/5m) carb absorption rate. Deprecated and of limited usefulness.
This line appears only when the older AMA algorithm is used.
Usually your real glucose curve ends up in the middle of these lines, or close to the one which makes assumptions that closest resemble your situation.
How AAPS turns predictions into a dosing decision
AAPS doesn’t dose insulin based on your current BG alone — every loop cycle (roughly every 5 minutes) it looks at all of the prediction lines above together and works out the safest course of action.
The core rule is safety first: if any prediction line, in any time frame, dips below your low safety threshold, AAPS issues a zero-temp (0% temporary basal rate) and withholds further insulin, even if your current BG is high. Only once every prediction line stays above that threshold will AAPS consider giving more insulin.
When it is safe to give more insulin, AAPS looks at where BG is ultimately predicted to end up (the eventual BG) across the blended predictions, and works out how much correction is needed to bring that eventual BG back to target — delivered either as an increased temporary basal rate, or (if the oref1/SMB algorithm is enabled) as a small immediate bolus. If BG is high now but is already trending down enough on its own, AAPS will hold off, or may even reduce the basal rate, rather than add insulin that would only push a later low even lower.
For worked examples of this decision logic with real screenshots, see the dosing scenarios in the Clinician’s guide — they were written for a clinician audience but apply to any AAPS user.
For the full technical treatment of how these predictions and the resulting dosing decision are calculated, see OpenAPS’s determine-basal documentation.
Basals
A solid blue line shows the basal delivery of your pump and reflects the actual delivery over time.
The dotted blue line is what the basal rate would be if there were no temporary basal adjustments (TBRs).
When the standard basal rate is given, the area under the curve is shown in dark blue. When the basal rate is temporarily adjusted (increased or decreased), the area under the curve is shown in light blue.
Activity
The thin yellow line shows the activity of Insulin.
It is based on the expected drop in BG of the insulin in your system if no other factors (like carbs) were present.
Section E - Additional graphs
You can activate additional graphs below the main graph. When in Simple Mode, additional graphs are preset and cannot be changed. Switch off Simple Mode if you wish to set your own configuration of additional graphs.
The additional graphs follow the main graph: when you scroll or zoom the BG graph, they move with it. A sideways drag on an additional graph also scrolls all the graphs. They have no time labels of their own — read the time on the BG graph.
To configure an additional graph, press the pencil icon in its top-right corner:

Select the chips corresponding to the data you want to see on this graph; the Remove button deletes the graph.
To create one more graph, press Add graph below the last graph and select its chips in the same way:

The new graph is added below the others — here a second additional graph with SENS% and DEV:

Most users find the following configuration of additional graphs to be adequate :
Graph 1 with IOB, BAS
Graph 2 with COB, Sensitivity change
Graph 3 with Deviations and BGI.
Absolute insulin (ABS)
Active insulin including boluses and basal.
Insulin on board (IOB)
Shows the insulin you have on board (= active insulin in your body). It includes insulin from bolus and temporary basal (but excludes basal rates set in your profile).
If there were no SMBs, no boluses and no TBR during DIA time this would be zero.
SMBs are shown on this graph as blue triangles, in three sizes following the amount compared with the largest SMB of the day.
IOB can be negative if you have no remaining bolus and zero/low temp for a longer time.
Decaying depends on your DIA and insulin type settings.
Carbs On Board (COB)
Shows the carbs you have on board (= active, not yet decayed carbs in your body).
Decaying depends on the deviations the algorithm detects.
If it detects a higher carb absorption than expected, insulin would be given and this will increase IOB (more or less, depending on your safety settings).
Sensitivity change (SENS%)
Shows the sensitivity that Autosens has detected.
Sensitivity is a calculation of sensitivity to insulin as a result of exercise, hormones etc.
Note, you need to be in Objective 8 in order to let Sensitivity Detection/Autosens automatically adjust the amount of insulin delivered. Before reaching that objective, the line in your graph is displayed for information only.
Variable sensitivity (VSENS)
Shows the sensitivity as calculated by DynamicISF. Only populated if you use this feature.
Heart rate (HR) & Steps
This data may be available when using a Wear smartwatch. Enable them on AAPS Wear app and give permission for health data.
Steps are drawn as columns, and the heart rate as a curved line that breaks where the watch sent no data.
Deviations (DEV)
Grey bars show a deviation due to carbs.
Green bars show that BG is higher than the algorithm expected it to be. Green bars are used to increase resistance in Autosens.
Red bars show that BG is lower than the algorithm expected. Red bars are used to increase sensitivity in Autosens.
Yellow bars show a deviation due to UAM.
Black bars show small deviations not taken into account for sensitivity
Blood Glucose Impact (-BGI)
This line shows the degree to which BG ‘should’ rise or fall based on insulin activity alone.

It is a good combination to display this line along with the Deviation bars. They share the same scale, but it is a different one than the other optional data, so it is a good idea to display them on a separate graph, as shown above. Comparing the BGI line and the Deviation bars is another way to understand how BG fluctuates. Here, at the time marked 1, the Deviation bars are well above the BGI line: BG rises more than insulin activity alone explains (for example after carbs). At the time marked 2, the Deviation bars are below zero (red): BG is lower than the algorithm expected.
Section F - QuickLaunch toolbar

The floating toolbar at the bottom of the screen holds your QuickLaunch actions. The small gear opens the QuickLaunch configuration where you choose which buttons are shown (treatments, careportal entries, CGM actions, the screens of the Manage sheet, Quick Wizard buttons, Scenes and more).
A typical configuration is shown above: Insulin, Carbs and the Bolus wizard.
While the pump is disconnected, the treatment buttons stay in the toolbar, for example to record insulin given with a pen (see Insulin below). The same actions are also available in the Treatments sheet of the bottom navigation.
Insulin
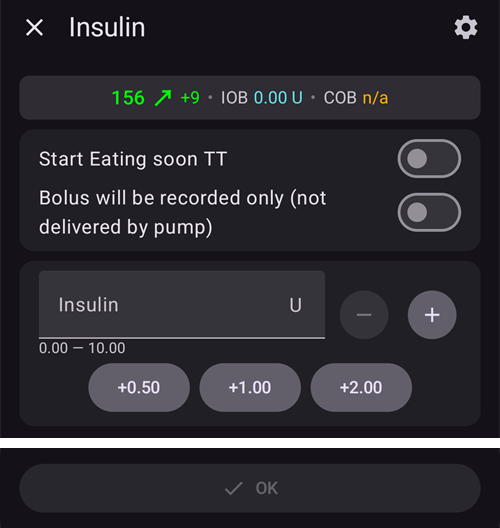
To give a certain amount of insulin without using the bolus calculator.
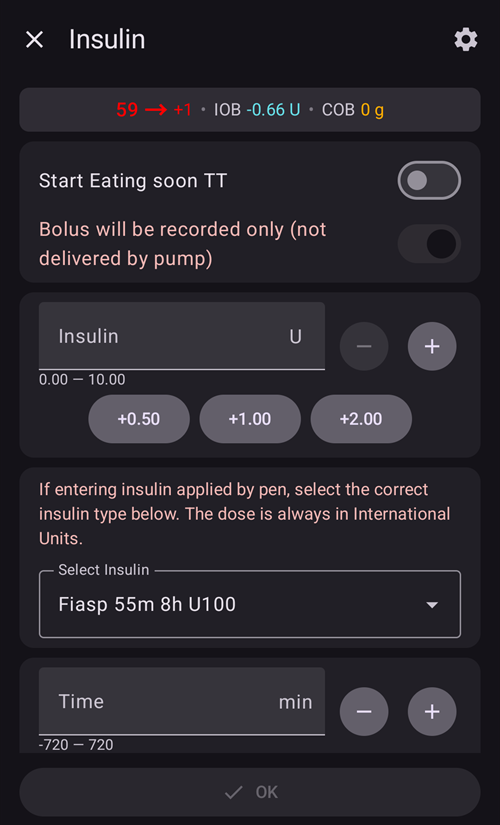
By enabling Start Eating soon TT, you can automatically start your eating soon temp target.
If you do not want to bolus through the pump but record an insulin amount (i.e. insulin given by pen) enable “Bolus will be recorded only (not delivered by pump)”. An additional Time row, set to Now, lets you record an insulin injection made in the past: use - / + to change it, or tap the chevron to type the minutes or pick a date and time.


You can use the +0.5 / +1.0 / +2.0 buttons to quickly increase the insulin quantity. The increment values can be changed in the Bolus wizard settings.
The insulin dialog can be used when the pump is suspended or disconnected as well, e.g. to record insulin injected with a pen. In this case, “Bolus will be recorded only (not delivered by pump)” is forced on (shown in red) and additional fields appear to select the insulin type and a Time offset for an injection made in the past:
Carbs
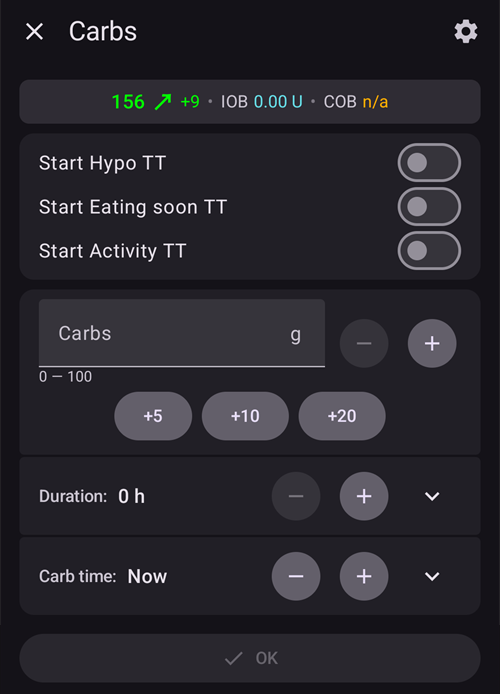
To record carbs without bolusing.
Certain pre-set temporary targets (Hypo, Eating soon, Activity) can be started directly with the switches on top.
Carb time: When will you / have you been eating carbs.
Duration: To be used for “extended carbs”. This row is folded, so that you do not type the grams into it by mistake: use - / + to change it, or tap the chevron to open it and type a value.
You can use the +5 / +10 / +20 buttons to quickly increase the carb amount.
Quick Wizard
Easily enter amount of carbs and set calculation basics with a single pre-configured button.
Details are set up in Quick Wizard.
Section G - Bottom navigation
The bottom navigation bar gives access to:
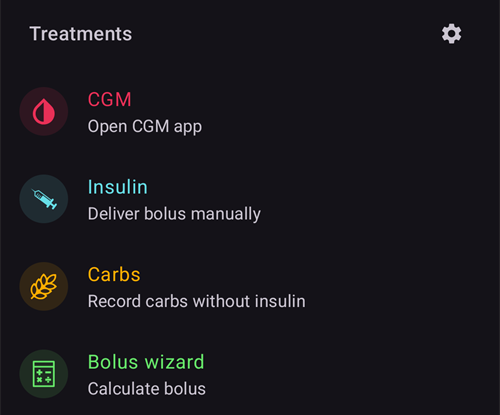
Treatments — a quick-actions sheet with your treatment actions:
Scenes — shown only when you have at least one scene or an Automation rule marked as User action. It opens a sheet from which you can start them; a badge shows how many you can start right now. The pencil at the top of the sheet opens Manage → Scenes.
Manage — the hub for everything you manage in AAPS: Profile, Insulin settings, Temp Target, QuickWizard, Scenes, Automation, Food, Site Rotation, Pump and Authorized clients. Below them are device and basal actions such as Sensor Insert and Temp Basal. Some items only appear when they apply to your setup — for example Prime/Fill and battery change depend on your pump, and Temp Basal, Extended Bolus and the Careportal entries are hidden in Simple Mode:

Objectives — your progress through the Objectives; a badge shows how many are completed. This item disappears once all objectives are finished, and is not present on AAPSClient.
Notifications
A notification bubble may appear above the bottom bar, on the right. It collects the active notifications of AAPS; the small number shows how many there are. Its color follows the most important one: red for an urgent message, green for a simple information.

Tap the bubble to open the Notification panel. Each message shows the time it was raised. Press Dismiss below a message to remove it; some messages have another button instead, to take you to the setting that needs your attention.


Bolus Wizard

When you want to make a meal bolus, this is where you will normally make it from.
Section I
The Calculation header shows the calculated bolus. If the amount of insulin on board already exceeds the calculated bolus then it will just display the amount of carbs still required.
The bolus calculator can be used whatever your current BG, including when it is too high or too low. If BG is above target, a correction is added to the meal bolus. If BG is below target, the bolus is reduced and, if the insulin already on board is more than needed, the calculator tells you how many carbs are still required instead of proposing insulin.
The icon row below the header shows which inputs enter the calculation (BG, trend, IOB, temporary target, COB). Pressing an icon enables / disables this entry from the calculation; the (i) icon shows the detailed numbers behind the calculation.
Combinations of COB and IOB and what they mean
For safety reasons, the IOB input cannot be disabled when COB is enabled as you might run the risk of too much insulin as AAPS is not accounting for what’s already given.
If you enable COB and IOB, unabsorbed carbs that are not already covered with insulin + all insulin that has been delivered as TBR or SMB will be taken into account.
If you enable IOB without COB, AAPS takes account of already delivered insulin but won’t cover that off against any carbs still to be absorbed. This leads to a ‘missing carbs’ notice.
If you bolus for additional food shortly after a meal bolus (e.g. additional dessert) it can be helpful to disable all inputs. This way just the new carbs are being added as the main meal won’t necessarily be absorbed so IOB won’t match COB accurately shortly after a meal bolus.
For safety reasons, a temporary target is only included in the calculation if you enable its input manually.
Section J - Entry fields
In the Carbs field, you add your estimate of the amount of carbs, in grams, that you want to bolus for; the + buttons below it add carbs quickly. AAPS only works with grams: if you count in bread units or exchanges (e.g. DAFNE “CHO” exchanges), convert them to grams before entering them. See the note about bread units on the profile page.
Carbs type: bread, cake or pizza
Below the Carbs field, the Bread, Cake and Pizza buttons tell AAPS how fast the meal is absorbed. With Cake and Pizza, the bolus covers only a part of the carbs now and the rest is added later as eCarbs. See Carbs type: bread, cake or pizza on the Extended carbs page for the percentages and timing.
The Correction row is if you want to modify the end dosage for some reason.
Only the Carbs field is always open. The other rows (Correction, Carb time, BG and Use percentage) are folded: they show their value with - / + buttons, so you can change it in small steps. Tap the chevron to open a row and type a value, and tap it again to close the row. This avoids typing grams into the Correction field by mistake.

Tap anywhere on the Profile row to open the list of your profiles, then tap a name to use that profile for this calculation.

The Carb time field is for pre-bolusing so you can tell the system that there will be a delay before the carbs are to be expected. You can put a negative number in this field if you are bolusing for past carbs.
Set alarm (eating reminder): when a carb time in the future is entered, a “Set alarm” switch appears so that you are reminded at the given time, when to eat the carbs you have input into AAPS:
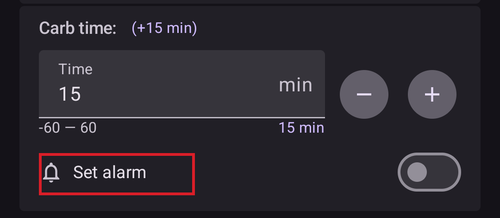
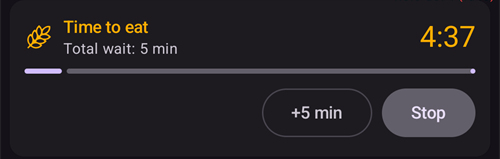
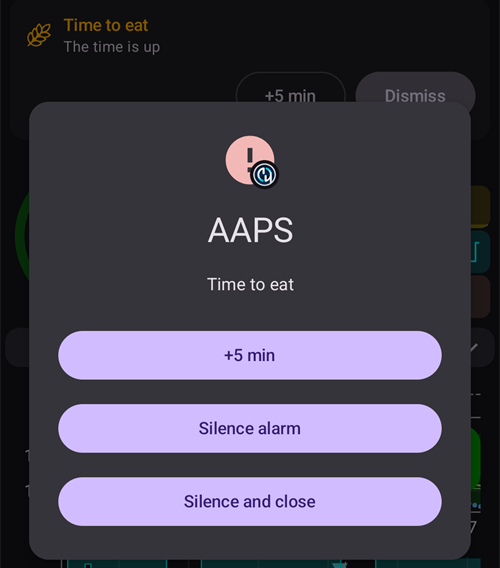
The reminder starts when the bolus has been delivered. While it runs, a Time to eat bar on the main screen counts down, with Stop and +5 min. +5 min moves the end of the wait five minutes later, and the bar shows the total wait. When the time has come, the reminder rings with its own sound, a soft kitchen timer. Besides Silence alarm (the screen stays open) and Silence and close, the alarm screen offers +5 min, which starts a new five-minute wait. Once it has rung, the bar reads The time is up with +5 min and Dismiss; Silence and close removes the bar too. The bar and the alarm are also shown on AAPSClient, and on the watch. The reminder does not create a timer in your phone’s clock app. If Android does not let AAPS set alarms, the wizard asks you to allow Alarms and reminders for AAPS in the Android settings. The bell is not offered for a carb time in the past.
The BG field is normally already populated with the latest reading from your CGM. If you don’t have a working CGM then it will be blank. When the reading is recent, the BG row stays folded. The field follows new readings while the wizard is open, until you change it yourself.
The result button at the bottom shows the proposed bolus; pressing it asks for confirmation before any insulin is delivered. While the confirmation is waiting, the loop gives no SMB, so the bolus you confirm is still right. If an SMB is being delivered at that moment, OK waits until it has finished.
Good to know:
If the calculated bolus is above your Maximum bolus, it is reduced to the max bolus, and the confirmation shows the warning “Bolus constraint applied”. A QuickWizard is refused instead.
When the bolus is only recorded (for example while the pump is disconnected), the “Bolus will be recorded only (not delivered by pump)” warning stays at the top of the dialog, also when you scroll.
A bolus you give by hand has priority over an SMB that is waiting to be delivered: the SMB is dropped and the loop calculates again. If an SMB is being delivered right now, your bolus is refused with the message “An SMB is being delivered right now. Try again when it has finished.” No insulin is given, and carbs entered with that bolus are not saved: wait a moment and enter them again.
Wrong COB detection

If you see the warning above after using bolus wizard, AAPS has detected that the calculated COB value may be wrong. So, if you want to bolus again after a previous meal with COB, you should be aware of overdosing!
For details, see the hints on COB calculation page.
Looking for the Actions tab of AAPS 3.x? Its functions moved to the main screen, the Manage sheet and the QuickLaunch toolbar: see Where did the Actions tab go?.
Careportal entries
The ages and levels shown in the status row (sensor, insulin, cannula, pump battery) are based on careportal entries: Prime/Fill (records pump site and insulin cartridge changes), Sensor Insert and Pump Battery Change.
You can record them from the expanded status panel on the main screen, from the Manage sheet, or with QuickLaunch buttons.
Prime/Fill records a pump site change and/or an insulin cartridge change, and can deliver a prime amount:

Sensor Insert and Pump Battery Change only ask for the time of the event:

 Exercise, announcement, question and note entries reflect the Nightscout careportal and are special forms of notes.
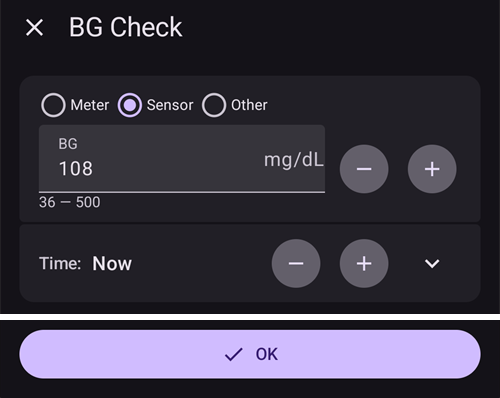
In the Manage sheet, scroll down and press Careportal to show these entries: BG Check, Note, Exercise, Question and Announcement.
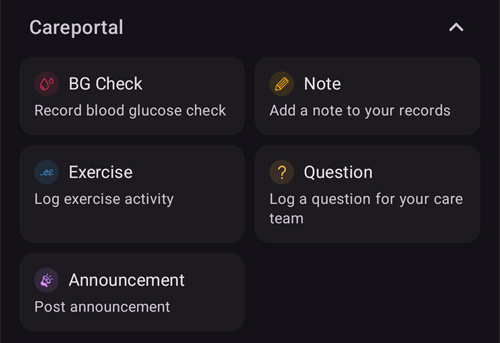
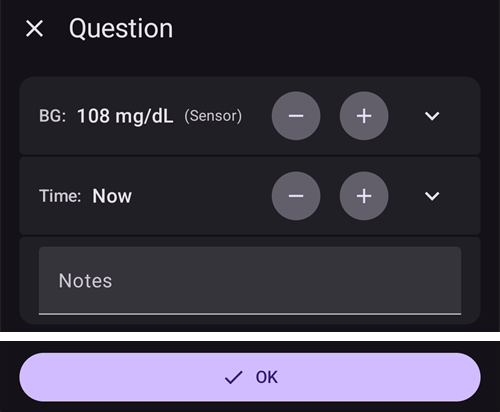
BG Check, Question and Announcement let you enter a glucose value (from a meter, the sensor or another source), a note and the time of the event. In Question and Announcement, the glucose row is folded and shows the meter type next to the value: if you change the value, the type changes from Sensor to Meter.
Note and Exercise let you enter a duration (a folded row: use - / +, or tap the chevron to type it), a note and the time of the event:
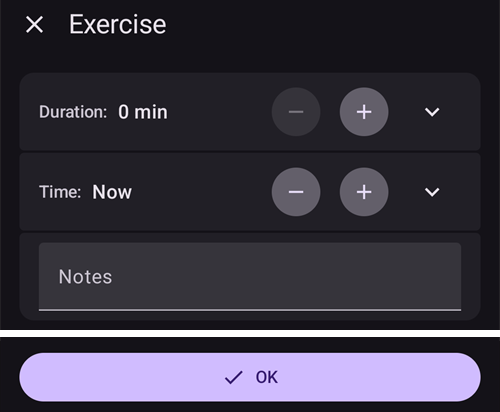
In all these dialogs (Prime/Fill, Sensor Insert, Pump Battery Change and the careportal entries), the time of the event uses the same Time row as the insulin dialog and the bolus wizard: use - / + to move the time in 5-minute steps (up to one week back and 12 hours ahead), or tap the chevron to pick any date and time.
Site Rotation
Manage → Site Rotation records where each cannula and sensor was placed on a body map, so you can rotate your sites: see Site Rotation on the Pumps and cannulas page.
TDD (total daily dose) and the basal/bolus ratio rule of thumb are explained with the Statistics Insulin tab.
Insulin

Manage → Insulin settings shows and manages your insulin configurations. Each configuration is shown on a card with its peak time and DIA; the one in use is marked ACTIVE. Below the card you see the activity curve. You can edit the nickname, peak and DIA of any configuration except the active one: to change the insulin you are using, add a new configuration and activate it.
See Duration of insulin action to learn more about what it is and how to set it.
Pump Status

Manage → Pump (or Configuration → Pump → Open plugin) shows the status of your pump: last connection, base basal rate, battery, reservoir…
Displayed information depends on your pump model.
See pumps page for details.
Loop, AMA / SMB
Configuration → Loop → Open plugin (and Configuration → APS → Open plugin) show details about the algorithm’s calculations and why AAPS acts the way it does: last run, the resulting request, and the constraints. The Loop screen lists only the constraints that actually limited the delivered temp basal rate or SMB (and why closed loop is not allowed, if that is the case); the APS screen lists every constraint that went into the calculation.
Calculations are run each time the system gets a fresh reading from the CGM.
For more details see the APS section of the Configuration page.
Profile

Manage → Profile (or a tap on the profile name on the main screen) opens the Profile screen: your profiles as a swipeable card carousel, with buttons to add, edit, clone, delete and activate a profile.
Profile contains information on your individual diabetes settings, see the detailed Profile page for more information.
Automation

Manage → Automation lists your automation rules. See the dedicated page here.
NSClient

Configuration → Communication → NSClientV3 → Open plugin displays the status of the connection with your Nightscout site: URL, websocket status, queue and a log of the synchronization activity.
Settings can be changed in NSClient settings.
For troubleshooting see this page.
BG Source - xDrip, BYODA…

Configuration → BG Source → Open plugin shows the history of CGM readings and offers the option to remove readings in case of failure (i.e. compression low) or duplicate readings.
Treatments history
Open the menu (☰) and select Treatments history to view, check and correct everything AAPS has recorded: carbs and boluses, temp basals, temporary targets, profile switches, careportal entries, loop mode changes and user entries. See Treatments history on the Reviewing your data page.
History Browser

Open the menu (☰) and select History browser.
Allows you to ride back in AAPS history. See the dedicated page Reviewing your data > History Browser.
Statistics

Open the menu (☰) and select Statistics.
Gives you statistics about your Total Daily Dose, Time In Range, your glucose profile over the day (AGP) and your insulin cycle pattern, on four tabs. See the dedicated page Reviewing your data > Statistics.
Profile Helper
Open the menu (☰) and select Profile helper.

The Profile helper lets you compare profiles and generate starting profiles for children. See Your AAPS Profile — sections Build a Profile from scratch for a kid and Compare two Profiles.
Home screen widgets
AAPS provides five widgets that you can add to your phone’s home screen, to see your data without opening the app. See the dedicated page Home screen widgets.